
CUSUM Algorithm
One of the control charts for detecting small changes is the Cumulative Sum (CUSUM), which was introduced by Page (1954) as a method for controlling continuous data. The CUSUM chart uses cumulative sums of deviations from the sample values to the target value, directly utilizing all the information in the sequence of sample values. Suppose the sample size is n ≥1 and the mean of the first j samples is . If the target value for the mean of this process is , then the CUSUM chart is created by plotting :
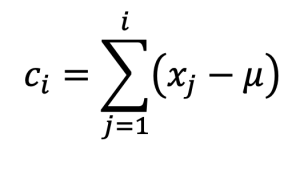
against the sample number i. The quantity is called the cumulative sum, which also includes the i-th sample. Many random phenomena rely on counting the occurrences of specific events within a given timeframe or location. For instance, this includes tracking the number of school absences per term, monthly asthma attacks per 100 children, or annual falls in an aged care facility. This statistical method is both accurate and powerful, but it assumes that the variable representing the number of occurrences follows a Poisson distribution, where the variance is equal to the mean. The parameter ; denotes the reference value and is typically chosen to lie between the desired target value and the out-of-control value, , that requires prompt identification. In the CUSUM method, which is based on the Poisson distribution, the value of 'k' is calculated using the following equation::

When this assumption is not met, it is advisable to use the alternative number model based on the negative binomial distribution, which is less powerful but more tolerant.
REFERENCE
MONTGOMERY, Douglas C. Statistical quality control. New York: Wiley, 2009.