
EWMA Algorithm
Exponentially weighted moving average (EWMA) was introduced by Roberts (1959). EWMA at time t is defined based on Yt statistic as
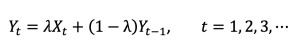
where Xt
is the number of patients (cases/ syndromes) and λ is the weighting parameter or smoothing constant value and includes different values between 0≤λ≤1. In above equation, the starting value of EWMA, Y0, is considered equal to the in control value μ0. Sometimes the average primary data is used as the in control value, therefore
![]()
Suppose σ is the standard deviation of Xt , if Yt is greater than the warning threshold level, the outbreak warning will be announced. The warning threshold level or upper control limit of EWMA is
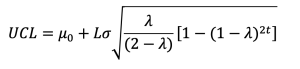
As time passes and the value of t increases, the expression [1 − (1 − λ)
2t ] approaches unity. Therefore, after the EWMA Algorithm has been executed for multiple time periods, the upper control limit will converge to a stable value.
 However, it is strongly recommended to use precise control limits for small values of t, as this helps maintain sensitivity and improve the algorithm’s performance in detecting out-of-control processes. The selection of values for the parameters L and λ based on the average run length significantly affects the performance of the EWMA algorithm. Several theoretical studies have been conducted on the characteristics of the average run length for the EWMA control chart. For example, the article by Lucas and Saccucci (1990) provides tables or charts of average run lengths for a range of L and λ values. In general, it is observed from multiple studies that values of L within the range of 2.60 ≤ L ≤ 2.80 and values of λ within the range of 0.05 ≤ λ ≤ 0.25 perform well. λ=0.05, λ=0.10, and λ=0.20 are popular choices. A good general rule is to use smaller values of λ for detecting smaller changes.
REFERENCES
Roberts S. Control chart tests based on geometric moving averages. Technometrics. 2000;42(1):97-101.
Hunter JS. The exponentially weighted moving average. Journal of quality technology. 1986;18(4):203-10.
Lucas JM, Saccucci MS. Exponentially weighted moving average control schemes: properties and enhancements. Technometrics. 1990;32(1):1-12.
Robinson P, Ho TY. Average run lengths of geometric moving average charts by numerical methods. Technometrics. 1978;20(1):85-93.
Waldmann KH. Bounds for the distribution of the run length of geometric moving average charts. Journal of the Royal Statistical Society: Series C (Applied Statistics). 1986;35(2):151-8.
Montgomery DC. Introduction to statistical quality control: John Wiley & Sons; 2020.